Free, browser-based tools
for sleep and circadian research
Score validated questionnaires and sleep diaries, process actigraphy and light exposure data, and estimate melatonin onset. All in your browser, with the data staying on your device.
No installation, no accounts, no uploads.
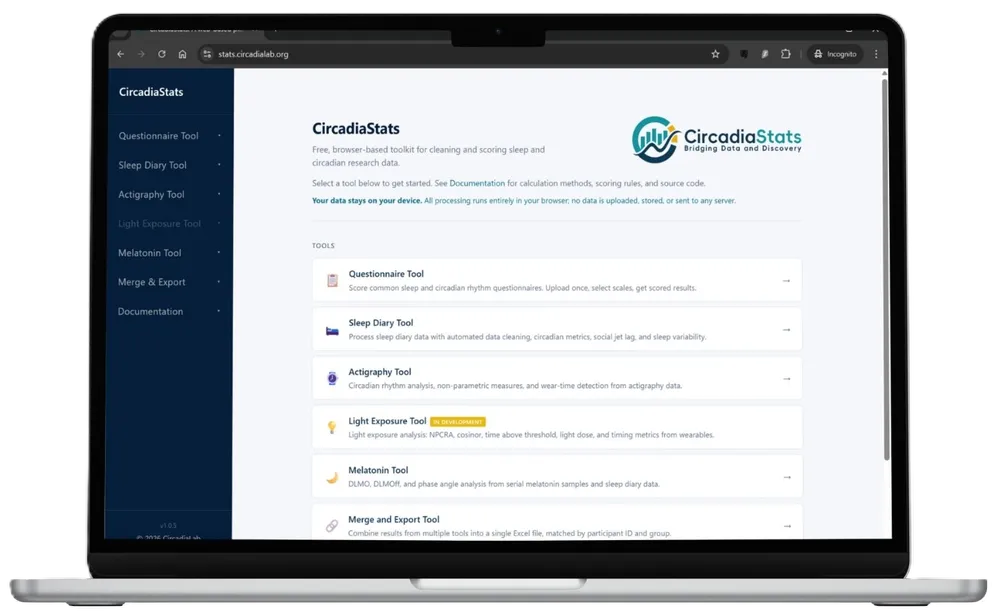
Five tools, one workflow
CircadiaStats consolidates the essential data preparation steps that researchers repeat across every sleep and circadian study. I built this platform to automate the repetitive tasks of questionnaire scoring, sleep diary processing, actigraphy analysis, light exposure metrics, and melatonin onset estimation.
Every tool runs independently in your browser with no accounts or installations required. The system produces analysis-ready outputs for SPSS or R, accompanied by a data dictionary and a cleaning report to ensure your methodology remains reproducible months later.
- Free: No paywalls, plan tiers, or trial periods.
- Browser-based: Access the suite on any modern device without installation or setup.
- Private by design: Your research data never leaves your computer because there is no server to receive it.
- Modular: Use a single tool or all five. Each module interoperates through a shared participant ID to streamline your analysis.
- Scientifically documented: Every calculation and method links directly to its published reference to maintain the highest standards of reproducibility.
A tool for each preparation step
Each tool is focused on one stage of the sleep and circadian analysis pipeline. Select a card to launch the tool in a new tab.
Questionnaire
Scores validated sleep, circadian, and mental health questionnaires from a single upload, including ISI, PSQI, MEQ, rMEQ, MCTQ, ESS, HADS, DASS-21, PHQ-9, GAD-7, DBAS-16, FIRST, and many more. Prefix-based column mapping with auto-detect, full response validation, and per-participant summary rows with scores, subscales, and severity categories.
Sleep Diary
Processes self-reported sleep timing following the Consensus Sleep Diary framework (Carney et al., 2012). Computes per-night derived metrics (TIB, TST, SOL, WASO, SE), per-participant summary statistics, circadian measures (MSFsc, social jet lag), and intraindividual variability (SD and RMSSD).
Actigraphy
Analyses activity count data from any wrist-worn actigraph, with user-mapped timestamp and activity columns. Includes cosinor fitting, harmonic cosinor, non-parametric circadian measures (IS, IV, L5, M10, RA), Lomb-Scargle periodogram, sleep-wake scoring (Cole-Kripke, Sadeh, or device-scored), and Choi non-wear detection.
Light Exposure Beta
Analyses personal light exposure data from wearable light loggers in lux or melanopic EDI. Segments timestamps into calendar days, cleans and optionally imputes gaps, then computes circadian light metrics, cosinor parameters, and threshold-based measures (time-above-threshold, light dose, and timing of exposure).
Melatonin & DLMO
Estimates dim light melatonin onset (DLMO) and offset (DLMOff) from serial saliva or plasma samples. Supports absolute, relative, and 2SD threshold methods alongside a visual-inspection mode, with sustained-rise validation, backward extrapolation, and phase angle analysis against sleep timing.
From raw file to analysis-ready
Every tool follows a consistent four-step process. The interface guides you through each stage and preserves your progress between sessions so you can pause and resume at any point.
-
1
Upload
Drop in CSV or Excel files directly. Templates are available for every module to ensure seamless compatibility. For actigraphy and light exposure data, upload multiple files with one participant per file.
-
2
Map and Clean
Identify the columns for timestamps, identifiers, and scale items. Columns are auto-mapped using fuzzy matching, with manual confirmation for anything ambiguous. Review flagged exclusions and define specific quality thresholds before the analysis begins.
-
3
Configure and Run
Select preferred methodologies such as DLMO threshold types or sleep debt baselines. Calculations run in a background worker to ensure the interface remains responsive even when processing large longitudinal datasets.
-
4
Export
Download the cleaned data containing per-participant summaries. Every export includes a data dictionary and a cleaning report. All files are ready for immediate use in SPSS, R, or other statistical software.
Your data never leaves your device
CircadiaStats runs entirely within your browser. No file you upload is ever transmitted to a remote server because there is no backend to receive it. This ensures absolute data privacy and makes the platform suitable for even the most sensitive clinical datasets.
Verify it yourself
Transparency is a core principle of this tool. You can confirm the lack of data transmission by following these steps:
- Open your browser developer tools by pressing F12.
- Switch to the Network tab.
- Upload a file and run any analysis.
- Observe that zero network requests contain your research data.
Core Privacy Principles
-
Zero account requirement. There is no sign-up process, no login, and no email required. You can begin processing data immediately without creating a digital footprint.
-
Client-side processing. Files are read directly into your browser's memory. Your raw data is never uploaded or sent to any external destination.
-
No persistent storage. Your research files are not saved to any backend database. Once you close the browser tab, the data is cleared from memory.
-
Simplified compliance. Because no data transfer occurs, most traditional data protection obligations do not apply. This significantly streamlines the process of securing institutional ethics and GDPR approval for your study.
Analysis-ready outputs
Every tool produces outputs designed for immediate use in SPSS, R, or any statistical software. The workbook is prepared so that the next step is analysis, not further cleaning.
Participant and group summaries
One row per participant, with optional per-group stratification. Core metrics are always included, and other optional columns are added based on the analyses you enable.
Data dictionary
Every exported column is defined with its unit, calculation method, and source reference. Ready to drop into your methods section or supplementary materials as-is.
Automated data cleaning
Impossible and improbable values are flagged automatically as errors or warnings, each with a plain-language explanation and a suggested action. Your source data is never modified; you decide what to exclude.
One-click filtering
Drop any flagged row from the analysis with a single click. Changes are reversible, and every inclusion or exclusion is recorded in the exclusion log for a full audit trail.
Interactive visualisations
Visualisations render directly in the browser at both individual and group level, and each can be exported as an image for reports or publications.
Exclusion log and metadata
Every excluded row is recorded with its reason and original values. Analysis parameters are exported alongside so the workflow can be reproduced exactly months later.
Built to stand up to scrutiny
A data-processing tool is only useful if you trust the outputs. CircadiaStats is built to stand up to review, replication, and continued validation.
Extensive documentation
Every tool ships with in-app documentation that covers its methods, formulas, and edge cases. Each calculation links to its published reference, so the work of writing up your methods section is already halfway done.
Reference R implementations
Every method is shown alongside its R reference implementation, with one-click copy to clipboard. You can paste the snippets into your own analysis script to replicate, audit, or extend the calculations on your own machine.
Reviewed against the literature
Each calculation is implemented to published specifications and reviewed against the cited reference. Known limitations and open questions are flagged transparently within the tool rather than left for you to discover.
Frequently asked questions
Answers to the questions researchers ask most often before adopting CircadiaStats for their analysis pipeline.
Getting Started
Who is CircadiaStats for?
Sleep and circadian researchers who need to score validated questionnaires or sleep diaries, process actigraphy or light exposure data, or estimate melatonin onset from assay data. It is equally useful for a student's first dissertation and a multi-site longitudinal cohort.
How do I get started?
Click Launch CircadiaStats and pick a tool from the dashboard. Each tool provides a template CSV so you can see exactly what format is expected.
Is CircadiaStats free?
Yes. CircadiaStats is free, with no plan tiers, no trial period, and no hidden costs. It is offered as a companion tool for the research community.
Do I need an account?
No. CircadiaStats does not have sign-up, login, or email collection. Open the URL and start working.
Data and Privacy
Does my data get uploaded anywhere?
No. CircadiaStats runs entirely in your browser. There is no backend server that could receive a file. Your uploads are read into browser memory, processed, and displayed. Nothing is transmitted.
How can I verify this?
Open your browser's developer tools (press F12), switch to the Network tab, and upload a file. You will see zero outbound requests containing your data. This is the most direct verification possible.
Does CircadiaStats use cookies or tracking?
The application stores configuration and uploads in your browser's localStorage so you can resume a session later. This never leaves your device. Anonymous page-level analytics may be present on this marketing site but are not used inside the tool itself.
Is CircadiaStats GDPR compliant?
CircadiaStats does not transfer, store, or access participant data on any server, so most GDPR obligations simply do not apply to the tool itself. Your own research group remains the Data Controller and must follow your institution's data handling policies as usual.
What if I close my browser mid-analysis?
Your configuration and uploaded data are saved to your browser's local storage automatically. When you return, the tool will offer to resume where you left off. You can also clear this storage at any time from the tool's settings.
Methods and Tools
What scoring methods are supported?
Questionnaire tools cover over 35 validated sleep and circadian scales. Sleep diary scoring follows the Consensus Sleep Diary. Actigraphy supports cosinor, harmonic cosinor, NPCRA, Lomb-Scargle periodograms, and sleep scoring with Cole-Kripke or Sadeh. Light exposure analysis covers NPCRA metrics, cosinor, threshold-based measures, and the Light Regularity Index. DLMO can be estimated using absolute threshold, percent-of-peak, and N×SD methods, plus a visual-inspection mode for manual scoring. Every method links to its published reference inside the app.
Where is the documentation?
Each tool has a dedicated Documentation page inside the app. Every page follows the same structure so you can find the detail you need quickly:
- Overview of what the tool does.
- Input Format: expected columns and file layout, with downloadable templates.
- Data Cleaning: how impossible and improbable values are flagged, and what counts as an error or warning.
- Methodology: full calculation details with formulas and source-code snippets. R implementations are included where relevant, so the underlying maths is never hidden.
- Export: every sheet and every column that appears in the output workbook.
- Limitations: known caveats and edge cases.
- References: each method linked to its published source.
For the specifics of any method, open the tool and tap the Documentation link in its header.
Can I use CircadiaStats with CircadiaLog?
Yes. CircadiaLog exports are designed to drop directly into the matching CircadiaStats tool. The participant ID column is shared across both projects, which makes merging results straightforward.
What do the "In development" and "Beta" labels mean?
Two status labels may appear next to a tool. Both exist so you can judge transparently whether a tool is appropriate for your use case.
In development means the tool is under active development. Its scoring methods may still change, and it has not yet been validated against an external reference dataset. Treat results as preliminary and check back for updates before committing them to a manuscript.
Beta means the tool is functional and the methods are settled, but some known issues are being addressed. Any active caveats are documented inside the tool. You can use the outputs, but you should read the caveats first.
Tools without either label are considered stable and validated.
What if I find a bug or want to suggest a feature?
Please get in touch via contact@circadialab.org. Feedback directly shapes what gets built next.
Start analysing your data now
CircadiaStats is free and ready to use in your browser. No registration, no install, no uploads.
Launch CircadiaStats